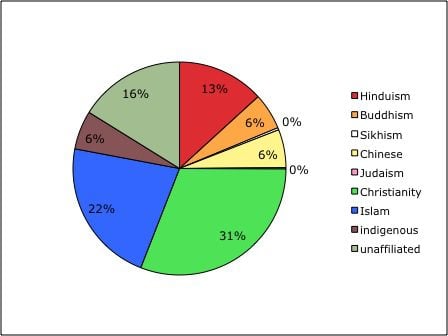
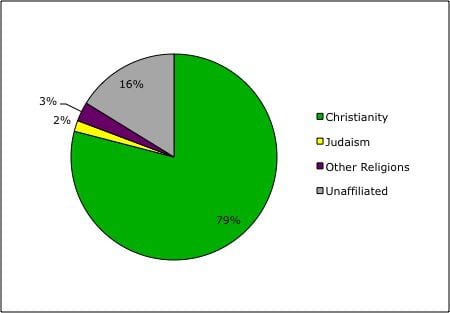
In my previous two posts, I presented a global religious pie chart, graphically displaying and comparing the relative sizes of the major religions of the world, based upon their own total global populations. Now, I’d like to present a similar sort of religious pie chart, but one based instead upon the relative population sizes of the major religions not around the world, but those that are predominant within the United States.

This U.S. religious pie looks quite a bit different from the global religious pie, doesn’t it? If nothing else, it should serve as a vivid reminder that the appearance of one’s own religious landscape at home may in fact scarcely resemble the much broader global religious landscape, as found out in the wider world beyond one’s familiar looking homeland.
Perhaps the biggest single difference between the domestic U.S. and the wider global religious landscapes, as indicated by their respective population pie charts, has to do with the size and scope of Christianity within each. On the global scene, Christianity is still the single largest religion, but not by such an overwhelming margin as it is on the American scene.
Worldwide, Christianity accounts for only about one-third of our planet’s total population. Within the U.S., however, Christianity amounts to roughly four-fifths of the domestic population. America is about as densely populated by Christians as India is by Hindus (Hinduism accounting for at least 80% of India’s own population). When I tell my students that the U.S. is overwhelmingly Christian, I’m not exaggerating.
We tend to think of the United States as a very religiously diverse place, as a great “melting pot” of faiths and spiritual paths. And it is — but that broad diversity and rich variety itself actually ranges through only a small minority of the total U.S. populace. Still, with a national population currently over 300 million, even a “small minority” thereof can amount to some pretty sizeable numbers of people.
As the U.S. pie chart indicates, Judaism in America isn’t a whole lot bigger than it is on the global scene; Jews comprise barely 2% of the U.S. population, compared with less than 1% of the total world population.
Looking at the global religious landscape, Muslims account for nearly a quarter of the total world population. Hindus, Buddhists, Confucians, Taoists, and followers of tribal religions in indigenous societies collectively amount to nearly another one-third of humanity. Yet within America, all of these faiths — Islam, Hinduism, Buddhism, Chinese religions, indigenous religions — taken together amount to only about 3% of the U.S. population. Looked at individually, each of these “other” religions would barely even register as a blip on our radar screen.
Apart from all of the differences, perhaps the biggest single similarity between the U.S. and the global religious “pies” (or the domestic vs. worldwide religious “landscapes” which these pie charts represent) has to do with the category of “religiously unaffiliated.” This slice in each pie encompasses both outright nonbelievers (atheists and agnostics) as well as those who may hold at least some religious or spiritual views but who simply do not formally affiliate themselves with any one particular faith or religious tradition (in other words, “nothing specific”).
Interestingly enough, in both pies — the global, and the domestic — the relative percentage of the religiously unaffiliated is about the same (16%). And in each pie, that makes for a pretty big slice, representing some pretty substantial numbers of people (both at home and abroad).
(To be continued, in Part Two.)